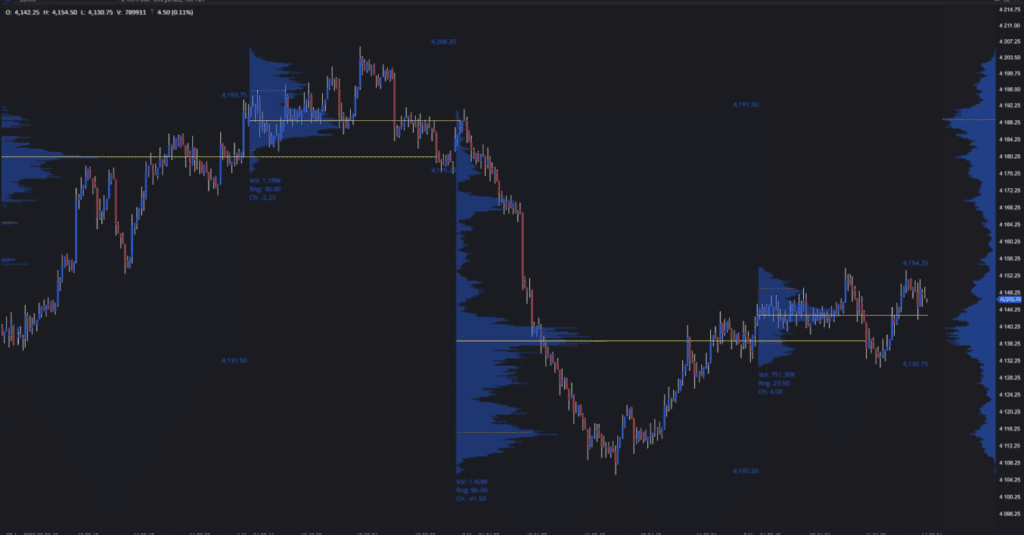
When we want to understand a set of chosen reoccurring sessions.

We utilize the volume profile study.
To customize the profiles we can navigate through the settings and adjust through each section
- General section
- We can adjust the profile period to consider daily, weekly, monthly etc. and whether you see them built for each or a cumulative last of x amount of periods
- The type of profile set up to display as either volume, tick, price built of at each price level of the market
- The set value area to be considered with the standard set to 70% roughly 1 standard deviation
- Visually we can adjust the transparency and alignment of the profile to either the left or right side
- Additionally we can smooth out the information displayed by changing either the smoothed ticks per price or/and the custom tick size placed active and adjust the ticks per price the will condense together
- To adjust how many profiles we tend to see we can hide the current building profile and restrict how many total profiles we get formed on the chart
- Profile settings section
- We can adjust the type of profile being displayed as x
- We can adjust the coloring for the profiles by x
- The profile width that each profiles take up over there period
- The opacities for the portion of the profile found within or outside of the value area
- The extension of naked pocs
- The extension of period high, lows, closes or x plus the color and style of the extended lines
- Turning active the split profile brings up the session templates for RTH and ETH sessions with an option to overlay the ETH over the RTH
- POC and Value Area Lines section
- The color of current, previous, and developing can be adjusted the style of current, previous and developing can be adjusted whether or not the current, previous and developing are active/inactive
- Graphics section
- Whether or not the summary found below the profiles is active/inactive
- The font and color of the summary
- The style and size of the summary text


